
Measure the drawing speed
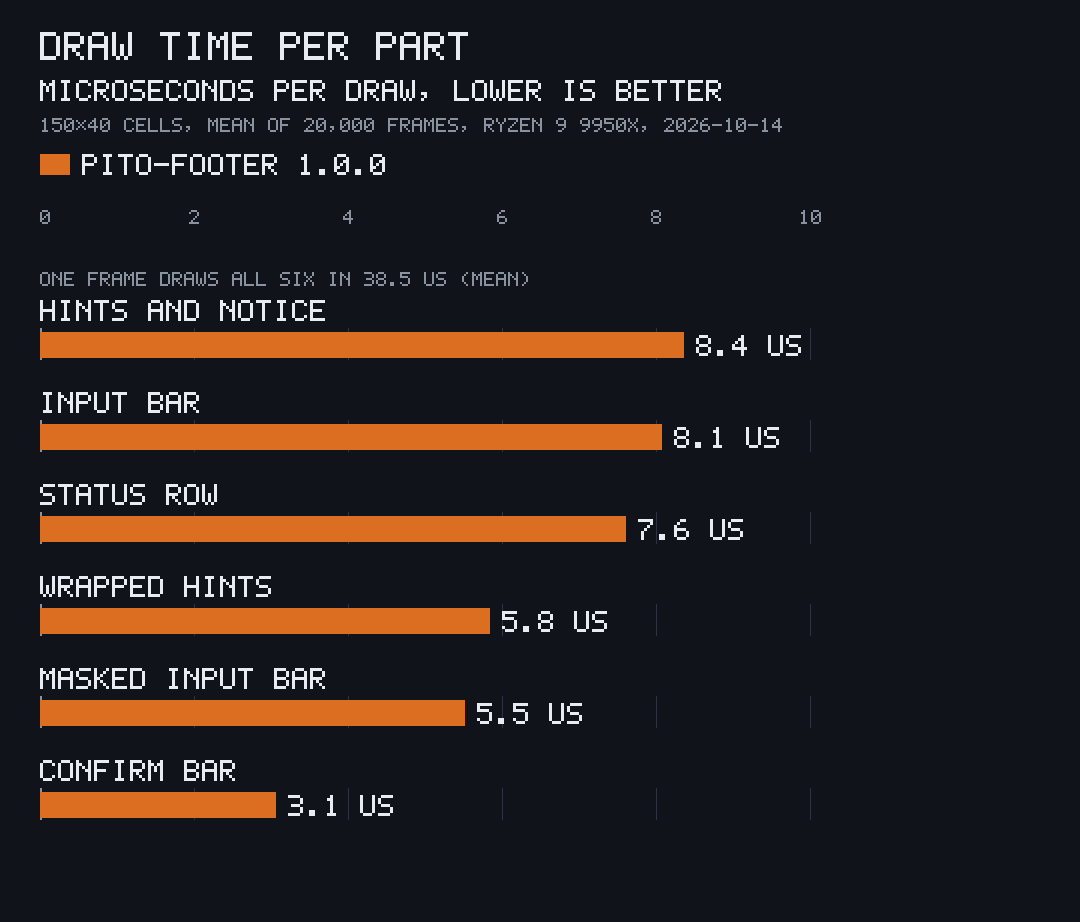
Drawing writes straight into ratatui’s buffer and allocates nothing; a counting allocator in the tests holds that. The bench draws 20,000 frames into a 150×40 buffer, each with twelve hints and a notice, a status row of five segments, the hints wrapped at 60 columns, a confirm bar, an input bar holding diacritics and wide glyphs, and a masked input bar, and times each part:
git clone https://github.com/gmrdad82/pito-footer && cd pito-footercargo run --release --example benchA number after -- sets the frames: cargo run --release --example bench -- 100000. It prints the mean and the worst frame, then the mean of each part:
pito-footer bench: 20000 frames at 150x40: mean 38.5 µs, worst … µs hints and notice: 8.37 µs status row: 7.61 µs wrapped hints: 5.85 µs confirm bar: 3.06 µs input bar: 8.08 µs masked input bar: 5.52 µsThose are the numbers measured once on 2026-10-14 on an AMD Ryzen 9 9950X under Linux with Rust 1.97.1, release profile, on the code released as 1.0.0, while other renders ran on the machine. A frame of all six parts takes 0.23% of a 60 fps frame. The worst frame depends on the machine’s load, so it is left out here.
| Frame of all six parts, mean | 38.5 µs |
| Allocations while drawing | 0 |
| Direct dependencies | 3 (4 with crossterm) |
| Crates in the build, the crate included | 42 |
Lines of Rust in src/, blank lines left out |
2,078 |
| Rebuild of the crate after a change, release | 1.5 s |
| Clean release build with every dependency | 32.8 s |
The build times are one run each on the same machine, with cargo’s default
jobs. The chart is drawn with
pito-compare from the repository’s
render/bench.toml.