
Measure draw time
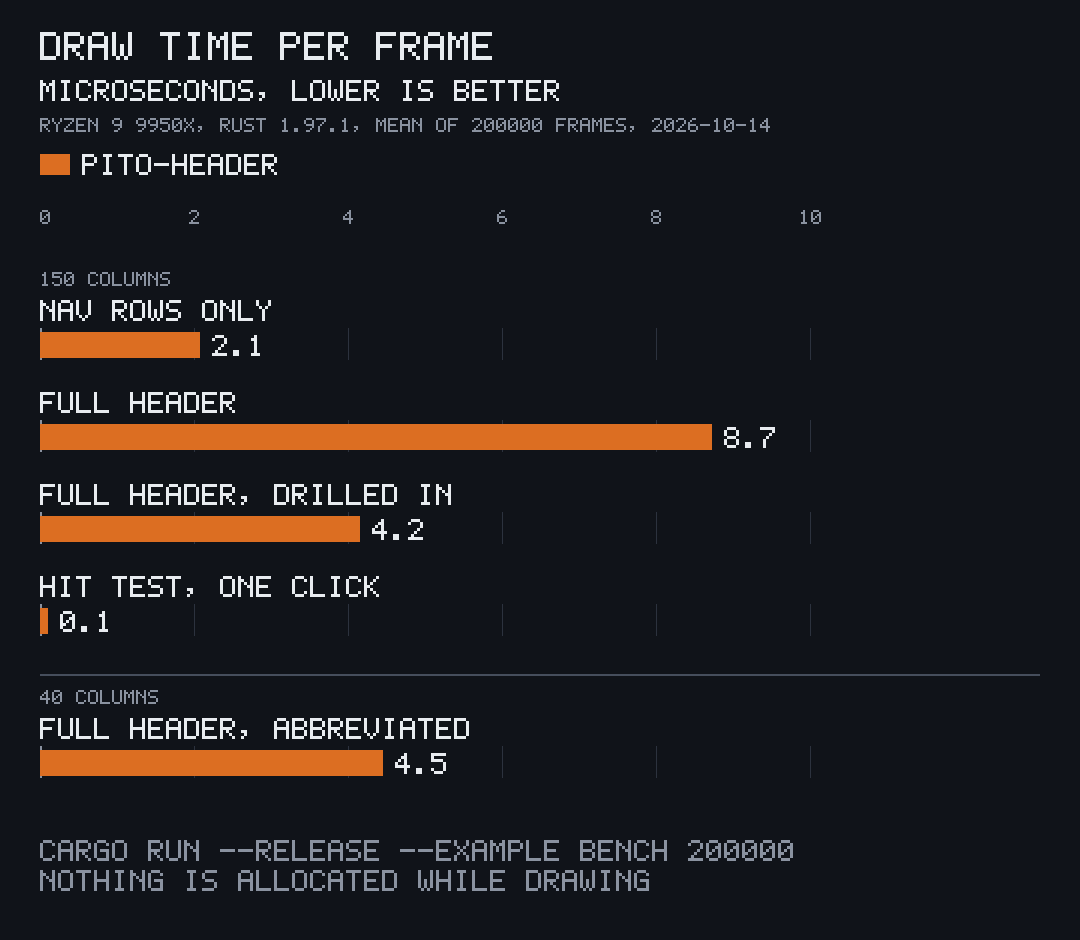
Drawing writes straight into ratatui’s buffer: no allocation, no clock, no input and no randomness, so a frame costs microseconds and the same state always draws the same cells. A counting allocator in the crate’s tests holds that drawing and hit-testing allocate nothing.
Run the bench
Section titled “Run the bench”From a clone of the repository, in release:
cargo run --release --example bench 200000The argument is the number of frames per case (20,000 when left out). It draws five cases into a 40-row buffer and prints the mean and the worst frame of each:
pito-header bench: nav rows: 200000 frames at 150x40: mean 1.75 µs, worst 117.1 µspito-header bench: full header: 200000 frames at 150x40: mean 6.81 µs, worst 138.0 µspito-header bench: full header, drilled in: 200000 frames at 150x40: mean 4.39 µs, worst 1013.7 µspito-header bench: full header, abbreviated: 200000 frames at 40x40: mean 4.69 µs, worst 598.3 µspito-header bench: hit test: 200000 frames at 150x40: mean 0.13 µs, worst 77.4 µsThat run was on an AMD Ryzen 9 9950X. The worst frame is mostly the one the operating system interrupted and moves from run to run, so read the mean.
| Case | What it draws |
|---|---|
| nav rows | the groups and sections rows alone, at 150 columns |
| full header | title with both slots, nav rows, a facts rule, a breadcrumb row and a notice on every other frame |
| full header, drilled in | the same, two levels deep, so the breadcrumb replaces the sections |
| full header, abbreviated | the full header at 40 columns, where every row abbreviates |
| hit test | one click hit-test on the nav rows, its column moving each frame |
The chart above is the mean of 200,000 frames per case, measured on 2026-10-14 with Rust 1.97.1 and drawn by pito-compare.