
Compare three or more
Paired bars take any number of parties. The first party is always the one being judged; versus names the one it is compared with, so a third party can stand there for scale without being in the tags.
Write the data
Section titled “Write the data”This one is JSON, and lower is better: it measures latency.
{ "title": "REQUEST LATENCY", "unit": "MILLISECONDS AT THE 99TH PERCENTILE", "better": "lower", "subtitle": "SAMPLE DATA, ONE SERVER, 200 CLIENTS", "date": "2026-10-11", "suffix": " MS", "versus": "CACHE V1", "parties": [ { "name": "CACHE V2" }, { "name": "CACHE V1" }, { "name": "NO CACHE" } ], "rows": [ { "label": "READ ONE KEY", "values": [0.8, 2.1, 14.0] }, { "label": "READ 100 KEYS", "values": [6.5, 9.7, 88.0] }, { "label": "WRITE ONE KEY", "values": [1.9, 1.7, 3.2] }, { "label": "SCAN A PREFIX", "values": [41.0, 39.5, 120.0] } ], "notes": [ "SAMPLE DATA FOR THIS README. EACH ROW COMPARES CACHE V2 WITH CACHE V1; NO CACHE IS THERE FOR SCALE." ]}Every row has one value per party, in the parties’ order. Without versus, the first party is compared with the second.
Draw it
Section titled “Draw it”$ pcmp latency.jsonlatency-paired.pnglatency-ratio.png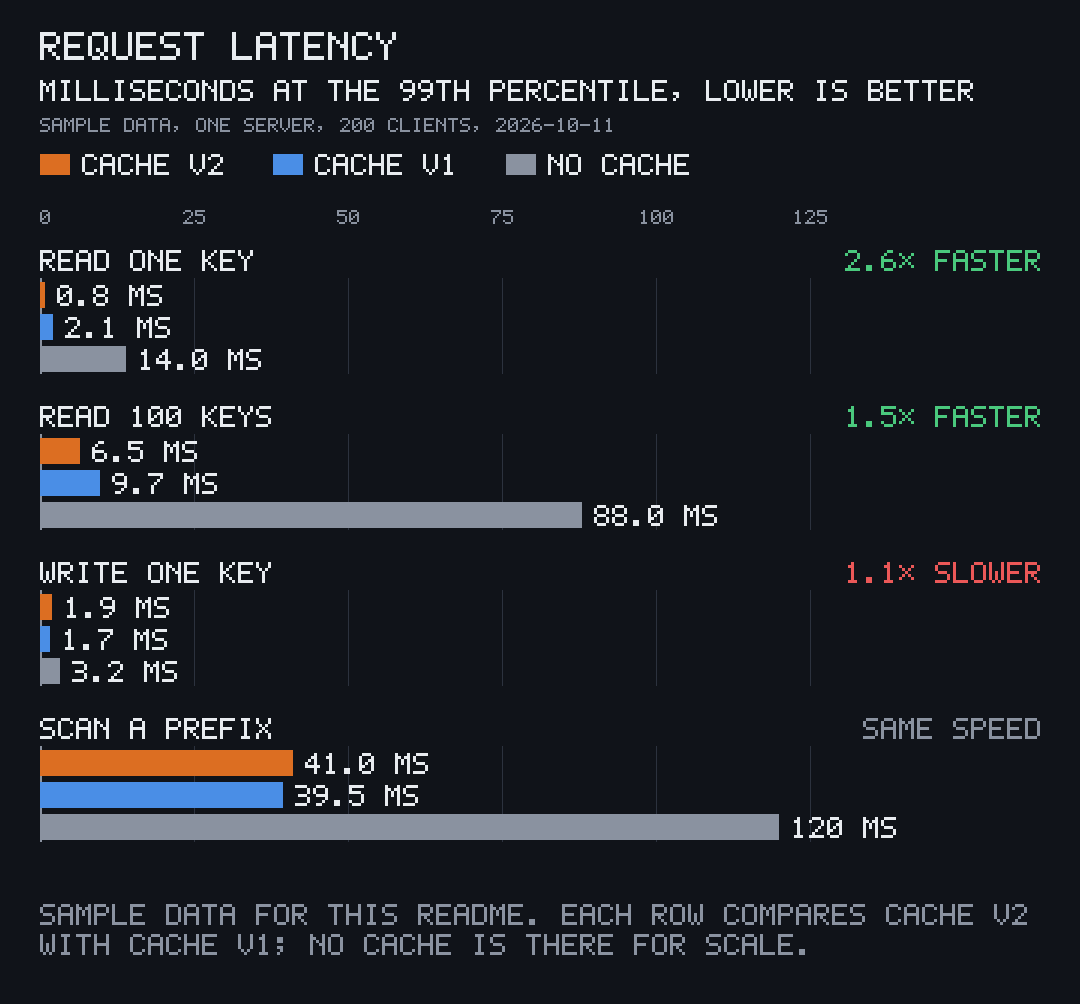
With better = "lower", the unit line reads LOWER IS BETTER and a smaller value counts as faster: READ ONE KEY is 2.1 / 0.8, 2.6× faster.
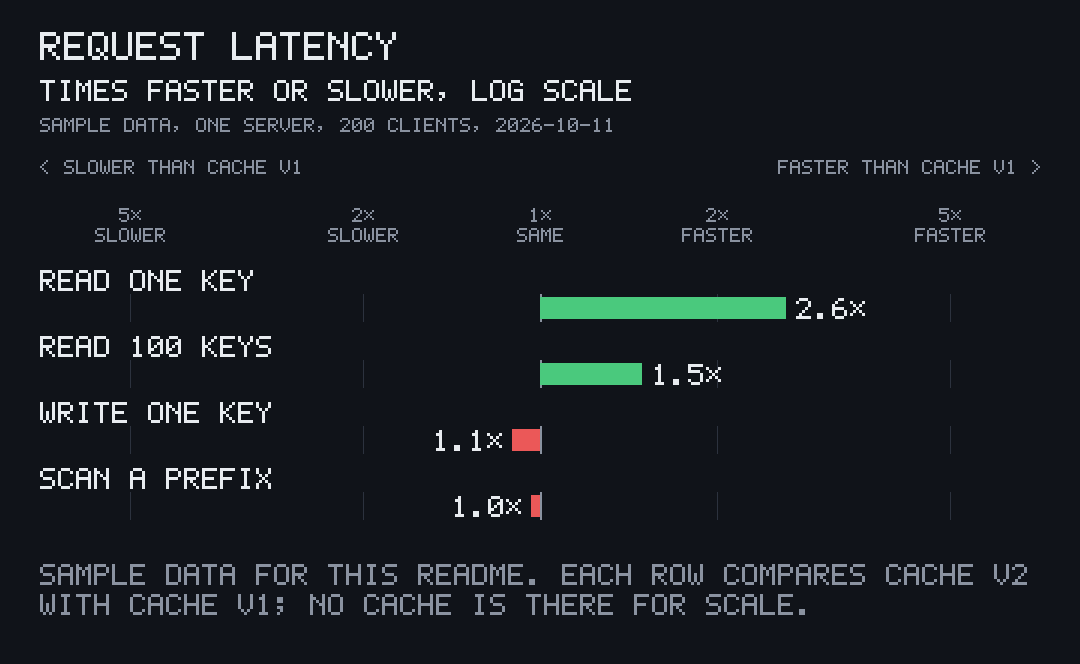
The ratio chart compares the same two, the first party and versus:
Values that aren’t speeds
Section titled “Values that aren’t speeds”The tags say FASTER, SLOWER and SAME SPEED by default. For sizes, scores or anything else, words changes them:
words = { better = "SMALLER", worse = "LARGER", same = "SAME SIZE" }Next: pick the colours when three or more parties need telling apart.