
Measure pcmp against matplotlib
pcmp draws its own benchmark. bench/speed.py in the repository times pcmp drawing each chart kind, then matplotlib drawing the same data as a similar dark 1080 px chart, and prints the numbers.
Run it
Section titled “Run it”On Linux or macOS, you need a clone of the repository, Rust 1.97 or newer, and Python with matplotlib installed:
git clone https://github.com/gmrdad82/pito-comparecd pito-comparecargo build --releasepython3 bench/speed.pyFor each chart kind it starts a new process per chart, 50 times, and takes the median, for pcmp and for matplotlib alike. Nothing but the benchmark needs Python.
What it measured
Section titled “What it measured”On 2026-10-14, on an AMD Ryzen 9 9950X (32 threads) under Linux, with Python 3.14 and matplotlib 3.11, while the machine was busy with other work (load 62 on 32 threads). bench/pcmp-vs-matplotlib.toml holds the numbers it printed, and pcmp drew them:
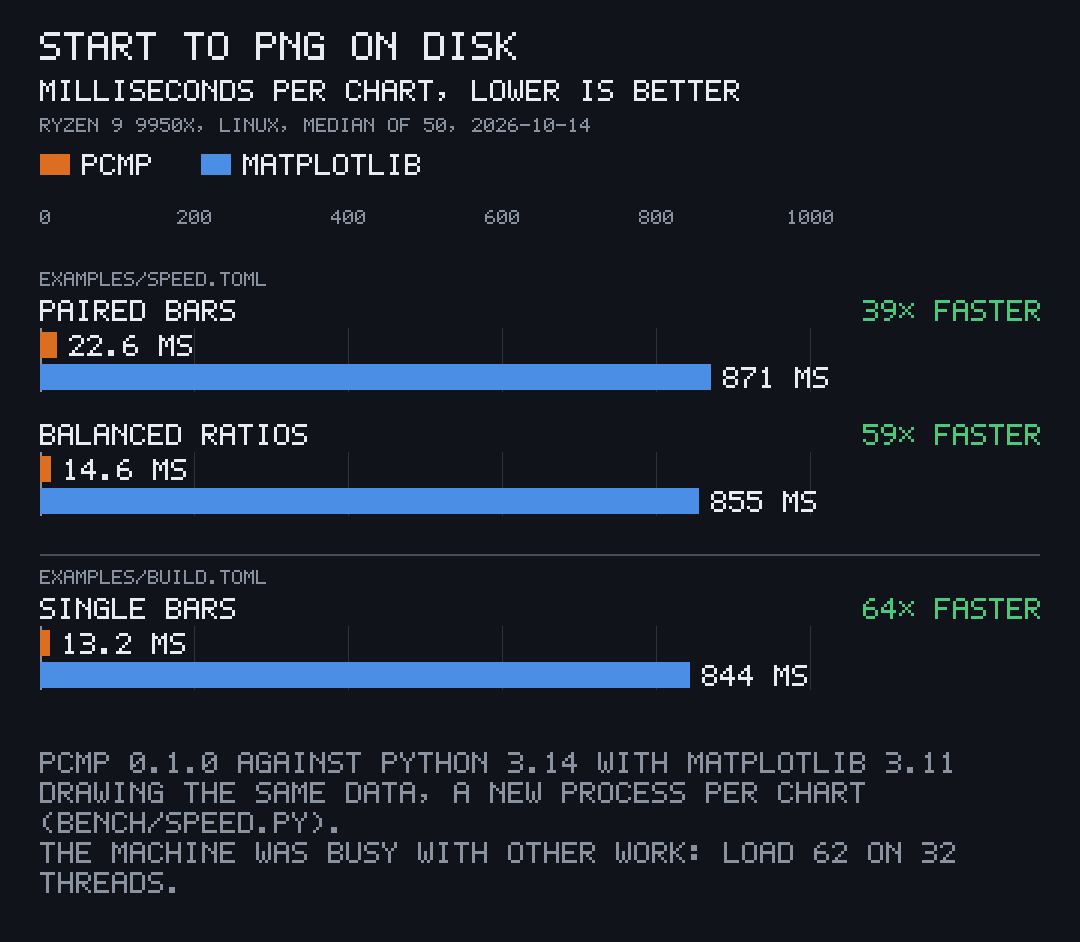
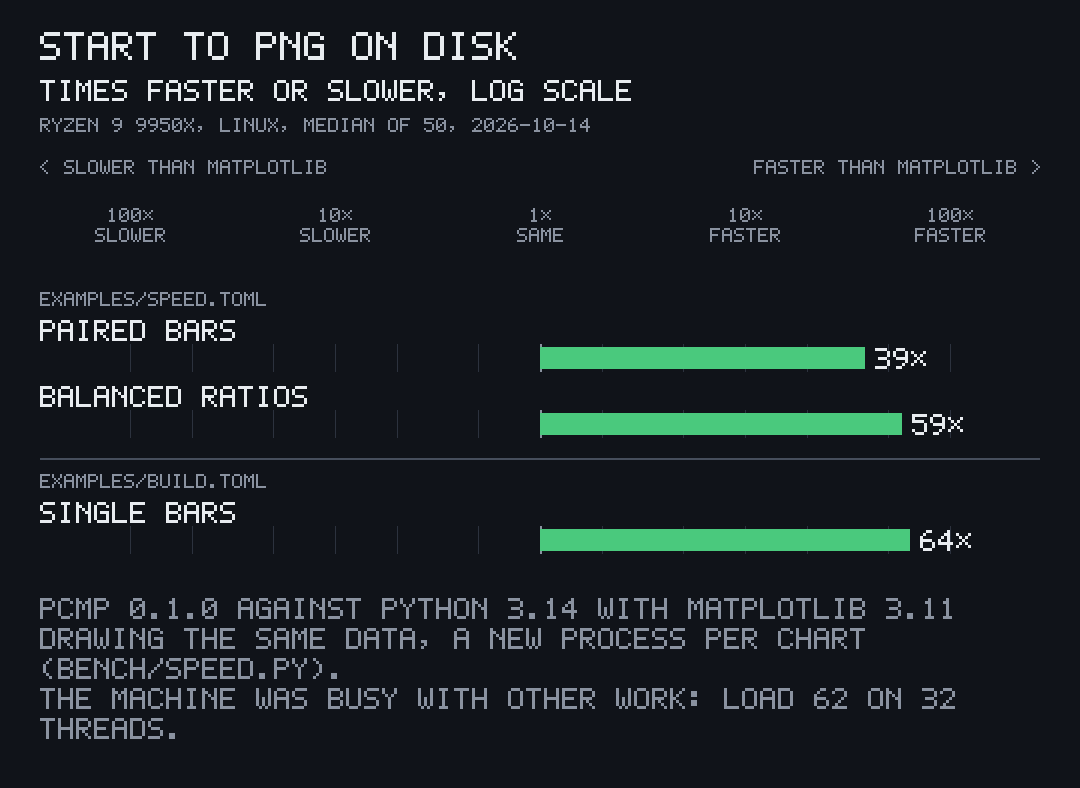
| pcmp | matplotlib | |
|---|---|---|
| Paired bars | 22.6 ms | 871 ms |
| Balanced ratios | 14.6 ms | 855 ms |
| Single bars | 13.2 ms | 844 ms |
| Peak memory | 13.3 MB | 82.5 MB |
Reading the numbers
Section titled “Reading the numbers”Most of matplotlib’s time is Python and its import, but not all: in one run, drawing and saving after the import took 235 to 282 ms per chart, over ten times pcmp’s whole run. The matplotlib chart is the plainer of the two (no tags, no pixel font), which favours it. A quiet machine is faster for both.
Chart your own benchmark
Section titled “Chart your own benchmark”The bench’s numbers are an ordinary data file. To chart your own, write your timings the same way, with better = "lower" for times, and draw them:
$ pcmp pcmp-vs-matplotlib.tomlpcmp-vs-matplotlib-paired.pngpcmp-vs-matplotlib-ratio.png