
pito-compare
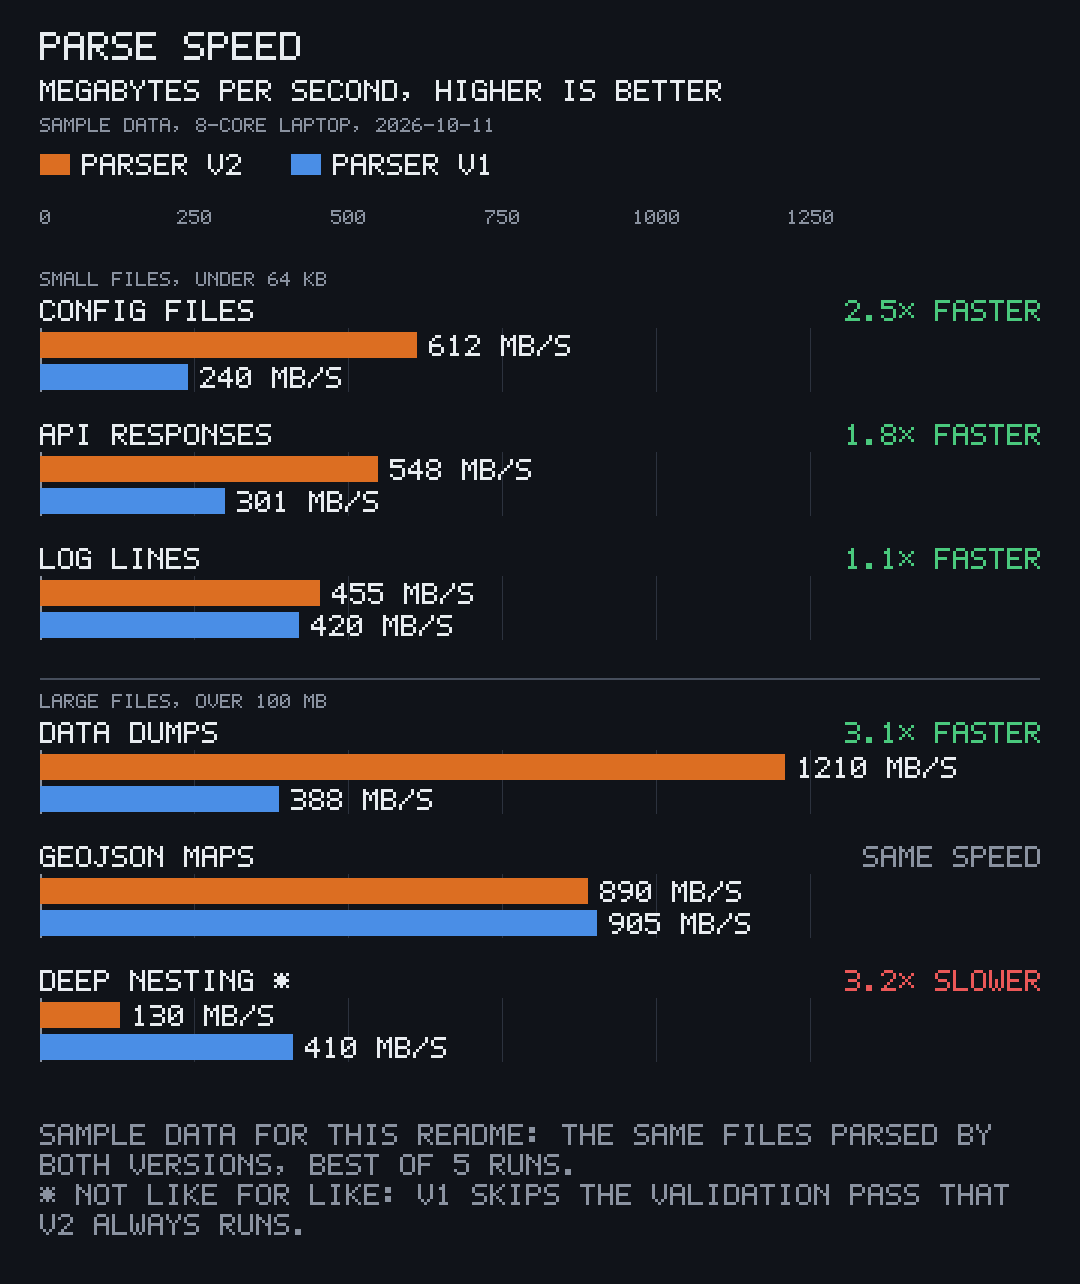
pito-compare draws benchmark comparison charts as PNGs, part of PITO MD. You write the numbers in a small JSON or TOML file, and pcmp draws them as dark, crisp charts in a hand-drawn pixel font: two or more parties side by side on one axis, how many times faster or slower one is than another, or plain bars. A chart takes 13 to 23 ms from start to PNG on disk, 39 to 64 times faster than matplotlib drawing the same data.
At a glance
Section titled “At a glance”| pcmp | |
|---|---|
| Time per chart, start to PNG on disk | 13.2 ms single bars, 14.6 ms balanced ratios, 22.6 ms paired bars |
| Against matplotlib 3.11, same data | 39× to 64× faster (844 to 871 ms per chart) |
| Peak memory | 13.3 MB (matplotlib: 82.5 MB) |
| Binary | 1.2 MB (Linux x86_64, release profile, stripped) |
| Dependencies | 5 direct: png, serde, serde_json, toml, and clap for the command line |
| Needs to run | nothing: one binary, no Python, no plotting library, no fonts on the system |
Measured on 2026-10-14 on an AMD Ryzen 9 9950X (32 threads) under Linux while the machine was busy with other work; times are the median of 50 runs, a new process per chart. Measure it yourself.
What it is
Section titled “What it is”Benchmark results read best as a picture, and a picture that looks the same every time. pito-compare is the chart drawer of pito-codecs’ benchmarks made into a tool, with its exact look: the colours, the 5x7 pixel font, 1080 px wide. There is no plotting library: the canvas, the font and the PNG writer are a few hundred lines of Rust, so a chart is drawn the same, pixel for pixel, on every machine.
It comes two ways: pcmp, the command line, and pito_compare, a Rust library that draws the same charts from data built in code.
Where to go next
Section titled “Where to go next”- Install pcmp and draw a first chart.
- Compare two versions: paired bars and the balanced ratio chart.
- Compare three or more: pick who the tags compare with, and charts where lower is better.
- Draw single bars when there is nothing to compare.
- Pick the colours of each party.
- Show text or your own ratio in place of a value.
- Read a refusal: what pcmp says when a data file is wrong.
- Draw from Rust with the library.
- Measure pcmp against matplotlib.
- Reference: the command line, the data format, the API, the changelog.