
Compare two versions
The most common chart: your new version against the old one, or your tool against another, row by row. Two parties draw two charts, the paired bars and the balanced ratios.
Write the data
Section titled “Write the data”Each party is a name, in the order its bars are drawn. Each row has a label and one value per party. better says which way wins: "higher" for speeds and throughputs, "lower" for times and sizes. Rows can sit under group headings.
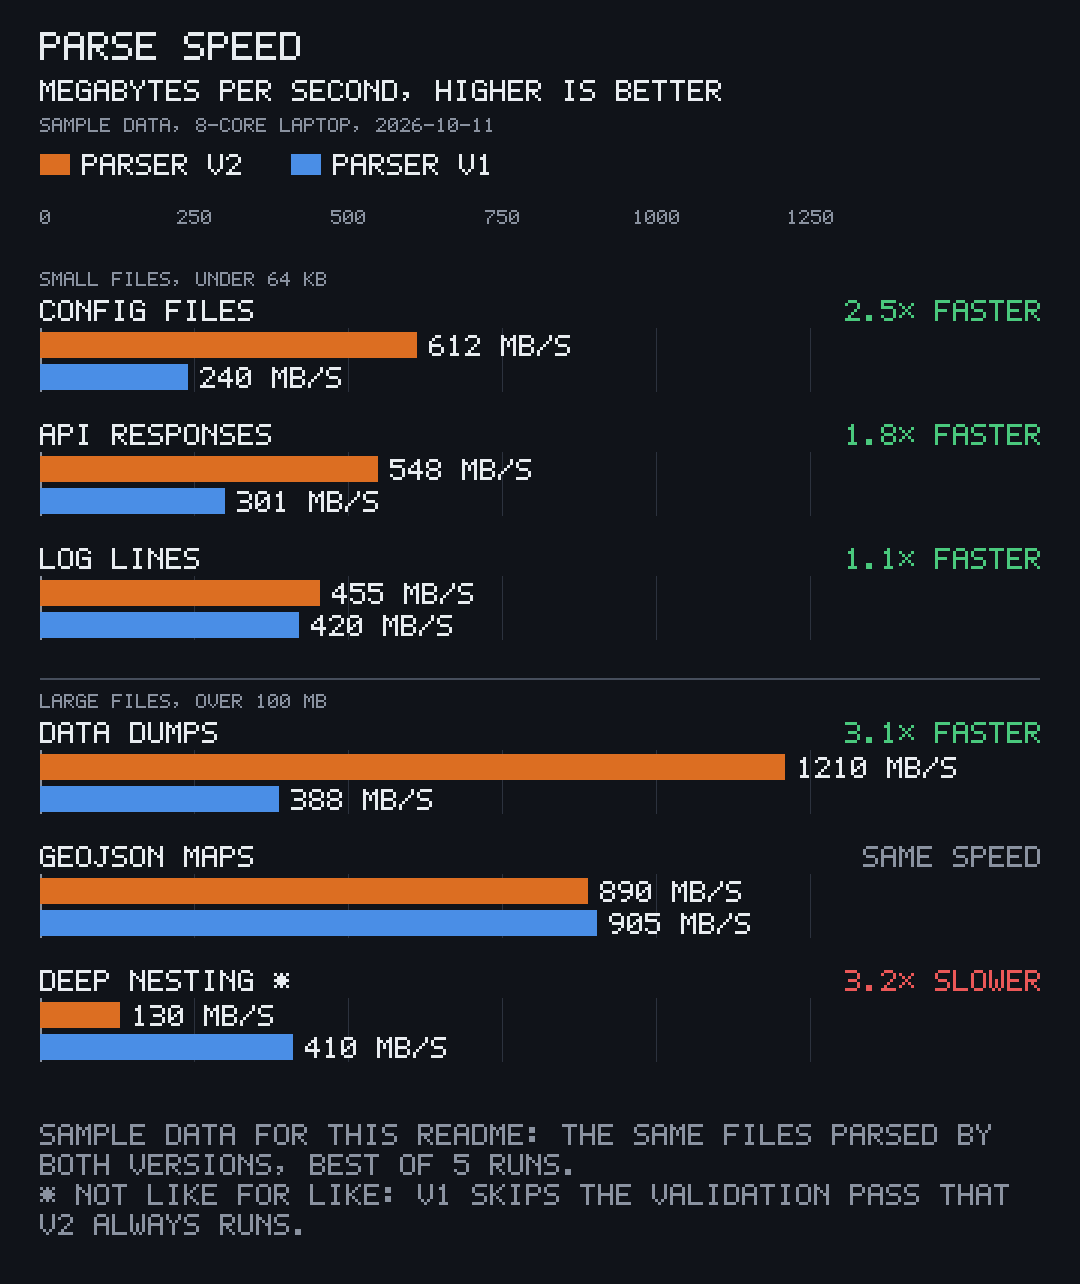
title = "PARSE SPEED"unit = "MEGABYTES PER SECOND"better = "higher"subtitle = "SAMPLE DATA, 8-CORE LAPTOP"date = "2026-10-11"suffix = " MB/S"notes = [  "SAMPLE DATA FOR THIS README: THE SAME FILES PARSED BY BOTH VERSIONS, BEST OF 5 RUNS.",  "* NOT LIKE FOR LIKE: V1 SKIPS THE VALIDATION PASS THAT V2 ALWAYS RUNS.",]
[[parties]]name = "PARSER V2"
[[parties]]name = "PARSER V1"
[[groups]]name = "SMALL FILES, UNDER 64 KB"rows = [  { label = "CONFIG FILES", values = [612, 240] },  { label = "API RESPONSES", values = [548, 301] },  { label = "LOG LINES", values = [455, 420] },]
[[groups]]name = "LARGE FILES, OVER 100 MB"rows = [  { label = "DATA DUMPS", values = [1210, 388] },  { label = "GEOJSON MAPS", values = [890, 905] },  { label = "DEEP NESTING", values = [130, 410], mark = "*" },]
subtitle and date make the small line under the unit. suffix is written after every value. A row’s mark goes after its label, and a note can explain it.
Draw it
Section titled “Draw it”$ pcmp speed.tomlspeed-paired.pngspeed-ratio.pngThe PNGs are named after the data file. --out charts puts them in charts/, made if missing.
The paired bars
Section titled “The paired bars”Both parties on one linear axis from zero, the value beside each bar. On the right of each row, how many times faster or slower the first party is than the second; a row whose ratio rounds to 1.0 reads SAME SPEED.
The balanced ratios
Section titled “The balanced ratios”1× in the middle, slower to the left and faster to the right, on a symmetric log scale: 3× slower is as long as 3× faster, so a win and a loss of the same size look the same size.
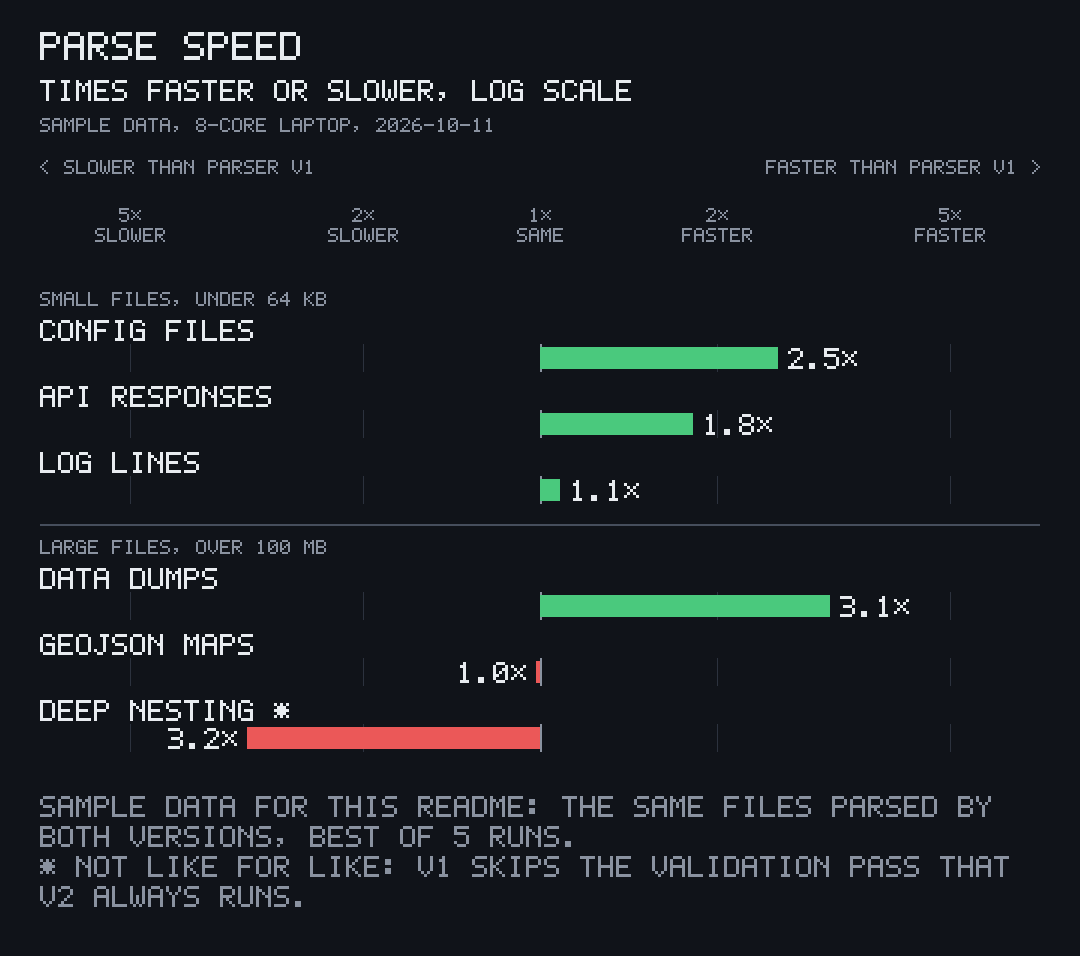
With better = "higher", a row’s ratio is the first value divided by the second; with "lower", the second divided by the first. Either way, above 1 means the first party wins.
Only one of the two
Section titled “Only one of the two”$ pcmp speed.toml --kind ratiospeed-ratio.png--kind paired draws only the paired bars. The same data in JSON is an object with the same keys; pcmp reads either by the file’s extension.
Next: three or more parties, or every field in the data format.