
Measure it on your machine
The crate carries two examples that measure it. Both draw into a ratatui buffer at 150×40 with no terminal, so they measure the list alone. Run them from a clone of the repository, in the release profile:
git clone https://github.com/gmrdad82/pito-listcd pito-listcargo run --release --example benchcargo run --release --example versusFrame times
Section titled “Frame times”bench draws five lists 20,000 times each and prints the mean and the worst
frame. One run on an AMD Ryzen 9 9950X under Linux:
pito-list bench: 20000 frames of a 20000-row list at 150x40: mean 236.5 µs, worst 849.9 µspito-list bench: 20000 frames of a lazy 100000-row list in groups of 25 at 150x40: mean 225.8 µs, worst 551.1 µspito-list bench: 20000 frames of a 20000-row list with a range, kept colours, a styled header and four rows rewritten a frame at 150x40: mean 242.6 µs, worst 8754.9 µspito-list bench: 20000 frames of a 20000-row list with columns that fit their cells, a cursor style and the drawn columns read at 150x40: mean 265.7 µs, worst 1336.1 µspito-list bench: 20000 frames of a shared 100000-item vector built on demand and handed over every frame, with a scrollbar and a count, at 150x40: mean 252.5 µs, worst 1653.3 µsThe means stay close whatever the list’s length, since only the rows on screen are visited. The worst frame is the machine’s, not the list’s: it moves from run to run with whatever else the machine is doing.
Against ratatui’s Table
Section titled “Against ratatui’s Table”versus draws the same 20,000 items, five columns with a header and the
selection moving every frame, four ways, and counts the allocations of each
frame with a counting allocator. ratatui’s own layout cache is on for its
Table:
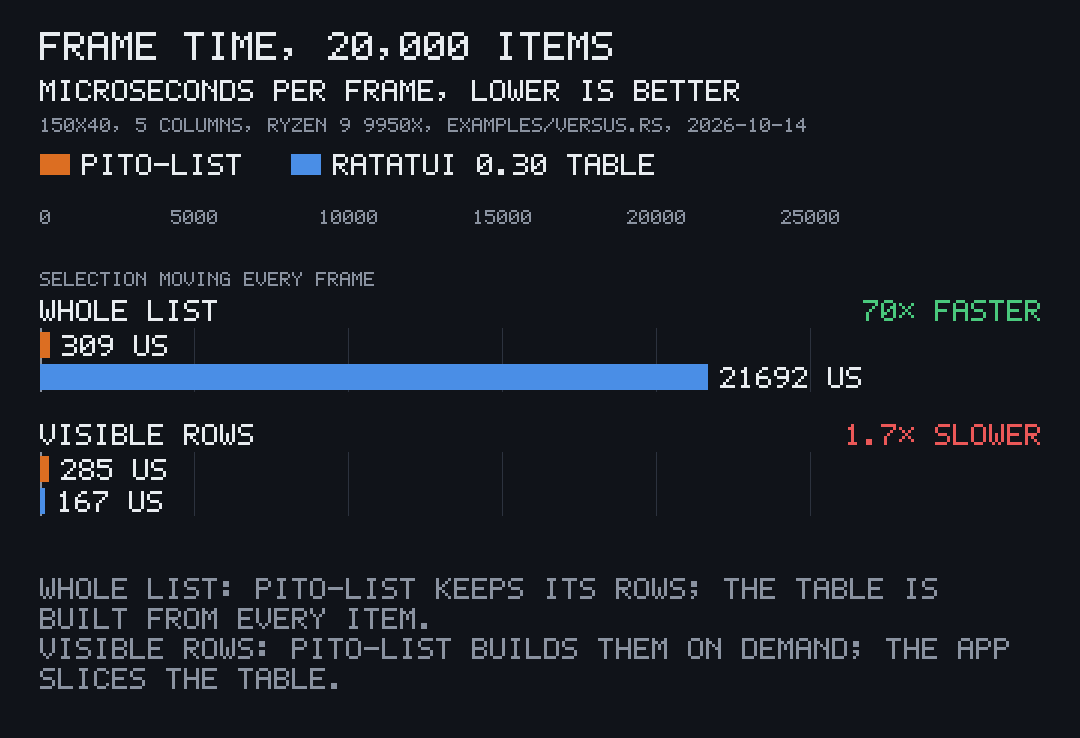
20000 items, 5 columns and a header at 150x40, the selection moving, 2000 frames eachpito-list, owned rows: mean 237.0 µs, 0.0 allocations and 0 bytes a framepito-list, shared vector built on demand: mean 237.3 µs, 292.4 allocations and 19663 bytes a frameratatui Table, every row built each frame: mean 17490.0 µs, 260062.0 allocations and 51844944 bytes a frameratatui Table, visible rows only, scrolled by the app: mean 159.1 µs, 569.0 allocations and 106032 bytes a frameA Table handed every row, the way ratatui’s own examples build one,
allocates 52 MB a frame and takes about 70 times longer. A Table handed only
the rows on screen is faster than pito-list, but then the app does the
scrolling itself, and it still allocates where pito-list’s owned rows don’t;
pito-list also drops columns, draws sections, ranges, the end line, the
scrollbar and the count in its time.
The charts on this page and in the overview come from a run on the same machine on 2026-10-14, so their numbers differ a little from the output above.
Allocations
Section titled “Allocations”The crate’s tests hold that a warm frame of owned rows allocates nothing:
cargo test --test allocation runs them under a counting allocator, drawing
ranges, styled headers, scrollbars and counts, rows rewritten in place and
shared row vectors handed over every frame. A list over a Shared source
allocates only what its builder does for the rows on screen.