
Performance
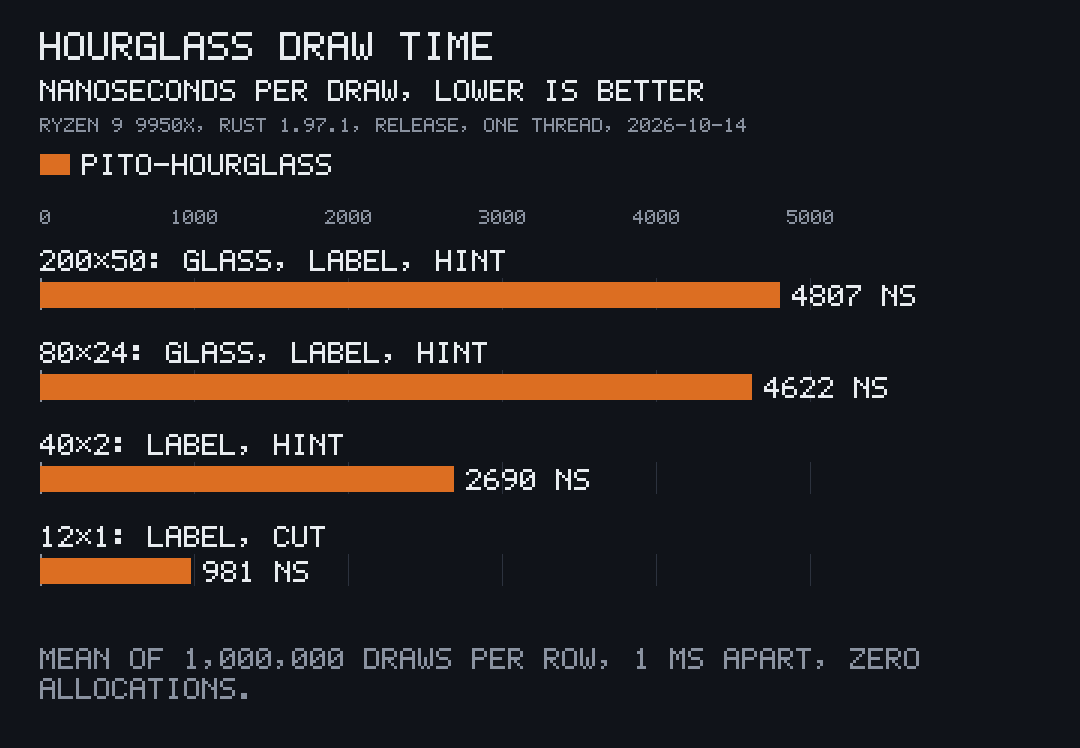
| Area | What’s drawn | Per draw |
|---|---|---|
| 200×50 | glass, label, hint | 4.8 µs |
| 80×24 | glass, label, hint | 4.6 µs |
| 40×2 | label, hint | 2.7 µs |
| 12×1 | label, cut | 1.0 µs |
A full draw takes under 0.03% of a 60 fps frame. The time doesn’t grow with the area: only the glass’s 66 cells and the label’s and hint’s characters are written.
How it’s measured
Section titled “How it’s measured”examples/bench.rs draws the widget into a ratatui Buffer a million times
per size, 1 ms of elapsed time apart, so every frame and band position comes
round, after a warm-up, and prints the mean time per draw as
pito-compare data. From a clone:
cargo run --release --example bench > draw-time.tomlMeasured once, on 2026-10-14, on an AMD Ryzen 9 9950X with Rust 1.97.1, a release build on one thread. The data behind the chart, with the machine line and note added by hand:
title = "HOURGLASS DRAW TIME"unit = "NANOSECONDS PER DRAW"better = "lower"suffix = " NS"subtitle = "RYZEN 9 9950X, RUST 1.97.1, RELEASE, ONE THREAD"date = "2026-10-14"notes = ["MEAN OF 1,000,000 DRAWS PER ROW, 1 MS APART, ZERO ALLOCATIONS."]parties = [{ name = "PITO-HOURGLASS" }]rows = [ { label = "200×50: GLASS, LABEL, HINT", values = [4807.0] }, { label = "80×24: GLASS, LABEL, HINT", values = [4621.5] }, { label = "40×2: LABEL, HINT", values = [2689.8] }, { label = "12×1: LABEL, CUT", values = [981.4] },]pito-compare’s pcmp draws the chart from it:
pcmp draw-time.toml --out .Zero allocations
Section titled “Zero allocations”Drawing allocates nothing. tests/allocation.rs counts every allocation
through a global allocator while 200 frames are drawn at six sizes, and holds
the count at zero; it runs on Linux, Windows and macOS on every CI run. From a
clone:
cargo test --test allocation