
Measure the speed
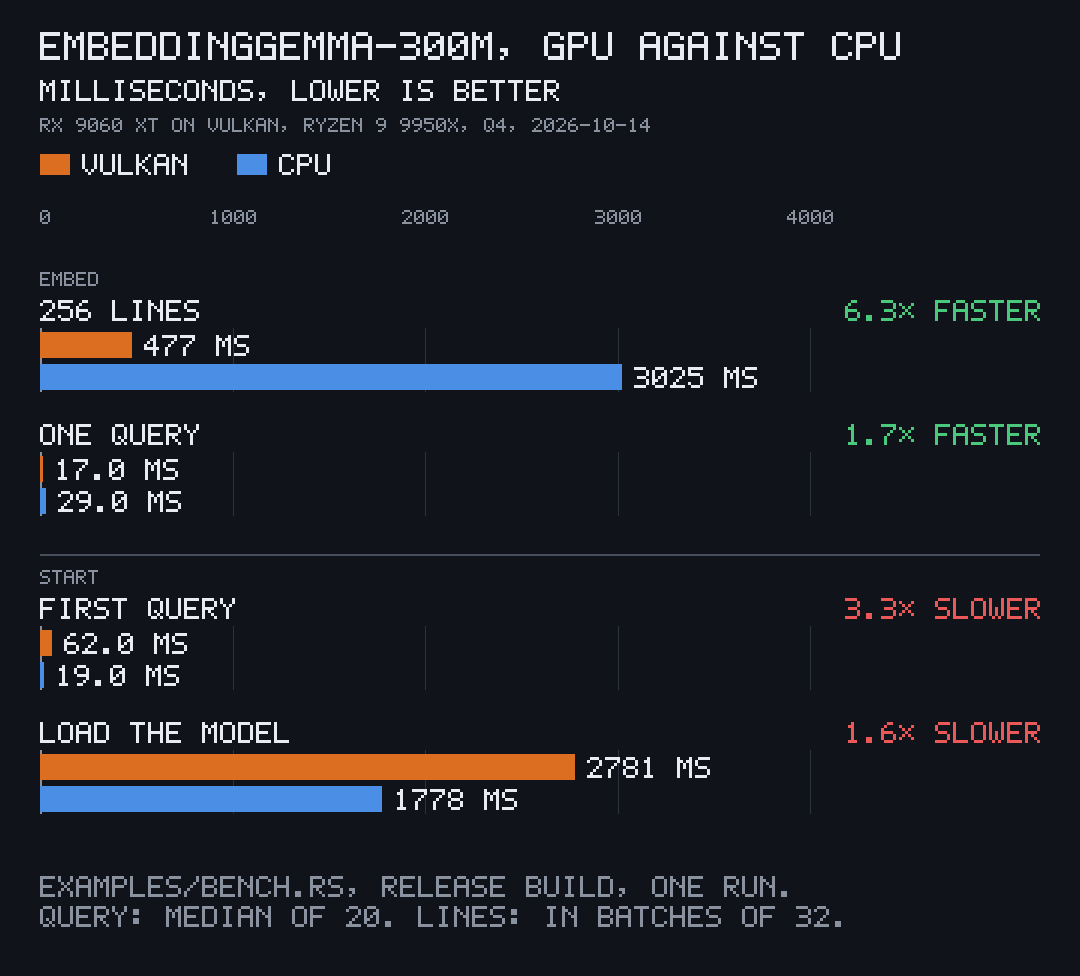
examples/bench.rs loads the model on the GPU device the build carries, then on the CPU, and times each step. It needs the model’s folder (see Get the model):
PITO_EMBED_MODELS=<the model's folder> cargo run --release --example benchIt prints one row per device. This is another run on the chart’s machine, with other work beside it:
EmbeddingGemma-300m q4, 256 lines in batches of 32, 20 queries
device             load  first query    query   256 lines     lines/sVulkan          2216 ms       133 ms    15 ms      374 ms         685the processor   1947 ms        34 ms    41 ms     3859 ms          66
The numbers move from run to run with what else the machine is doing; the gap between the GPU and the CPU on batches stays. If the card refuses the model, its row says so and is skipped.

The clip was recorded while the machine was busy rendering, so its CPU row is slower than the chart’s.
What each column means
Section titled “What each column means”- load:
Embedder::load, reading the files and setting up the provider. - first query: the first
embed_queryafter loading. On the GPU it sets up the shaders, so it costs more than the next ones. - query: the median of 20 single queries.
- 256 lines: 16 short lines repeated with a number, embedded in 8 batches of 32.
- lines/s: 256 divided by that time.
How the chart was measured
Section titled “How the chart was measured”One run of examples/bench.rs, release build, on 2026-10-14: an AMD Radeon RX 9060 XT (16 GB) on Vulkan (Mesa RADV) against an AMD Ryzen 9 9950X (16 cores, 32 threads) with ONNX Runtime’s CPU provider, Linux, EmbeddingGemma-300m q4 at the pinned commit, with the library code of v1.0.0. The GPU shared its queue with one other job during the run. 256 lines took 477 ms on Vulkan (536 lines a second) against 3,025 ms on the CPU, 6.3× faster; one query 17 ms against 29 ms. The chart was drawn by pito-compare.
macOS (CoreML) builds and passes CI on the CPU; its GPU path is untested on Apple hardware here.