
Measure on your machine
The numbers on the overview come from the numbers example.
Run it on your own machine from a clone of the repository:
cargo run --release --example numbersIt needs a release build: a debug build is many times slower and says
nothing about what an app will see. It writes its databases under the
system’s temporary folder, in pito-sync-numbers/, and removes them when it
ends. This is one run on a busy Linux machine:
open, a new database 115.58 msopen, an existing database 109.9 µsResync to its closing Changed 28.8 µs (p99 395.9 µs)a pass of 10,000 rows 1.86 ms (5.37 M rows/s)a UI read, writer idle 8.7 µsa UI read, writer busy 36.7 µs (p99 147.3 µs, max 8.18 ms; 2530 reads, 670 passes) SQLite defaults, writer busy 147.7 µs (p99 3637.15 ms, max 3637.15 ms; 5 reads, 76 passes)What each line times
Section titled “What each line times”Every figure is a median unless it says otherwise.
| Line | What it does |
|---|---|
| open, a new database | open on a path that doesn’t exist yet: the folder, the file, WAL and the schema |
| open, an existing database | open on a file already built at the right version |
| Resync to its closing Changed | a Resync sent to a running source, until its pass’s closing Changed arrives |
| a pass of 10,000 rows | a commit that deletes and inserts 10,000 rows with the sync row |
| a UI read, writer idle | a page of 50 rows and the sync row through reader’s connection |
| a UI read, writer busy | the same read every millisecond for three seconds while a source commits 10,000-row passes back to back |
| SQLite defaults, writer busy | the same reads and writer on plain connections with SQLite’s defaults: rollback journal, synchronous=FULL |
The last two lines are the chart in read from the UI. Your numbers depend on the CPU, the disk, the filesystem and what else the machine is doing; the run above and the overview’s were both made while other builds were running.
The steps compared
Section titled “The steps compared”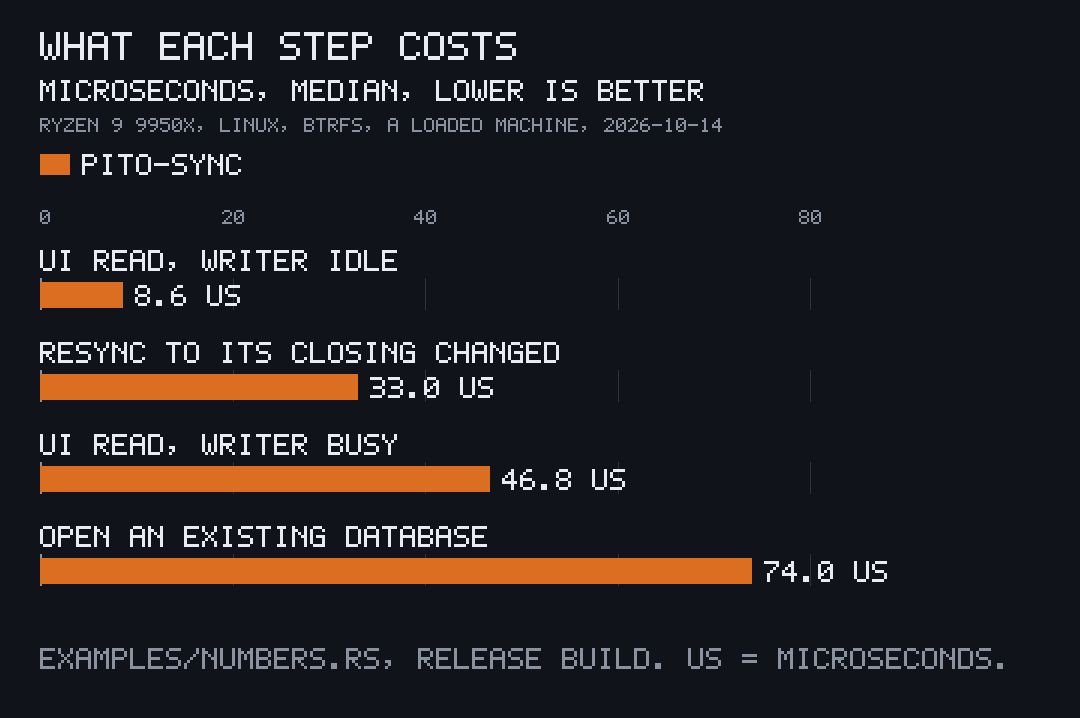
The chart is the overview’s run. The first open of a new database is the
slow one, at over 100 ms in both runs, and it happens once per install or
schema version; every open after that takes well under a millisecond.